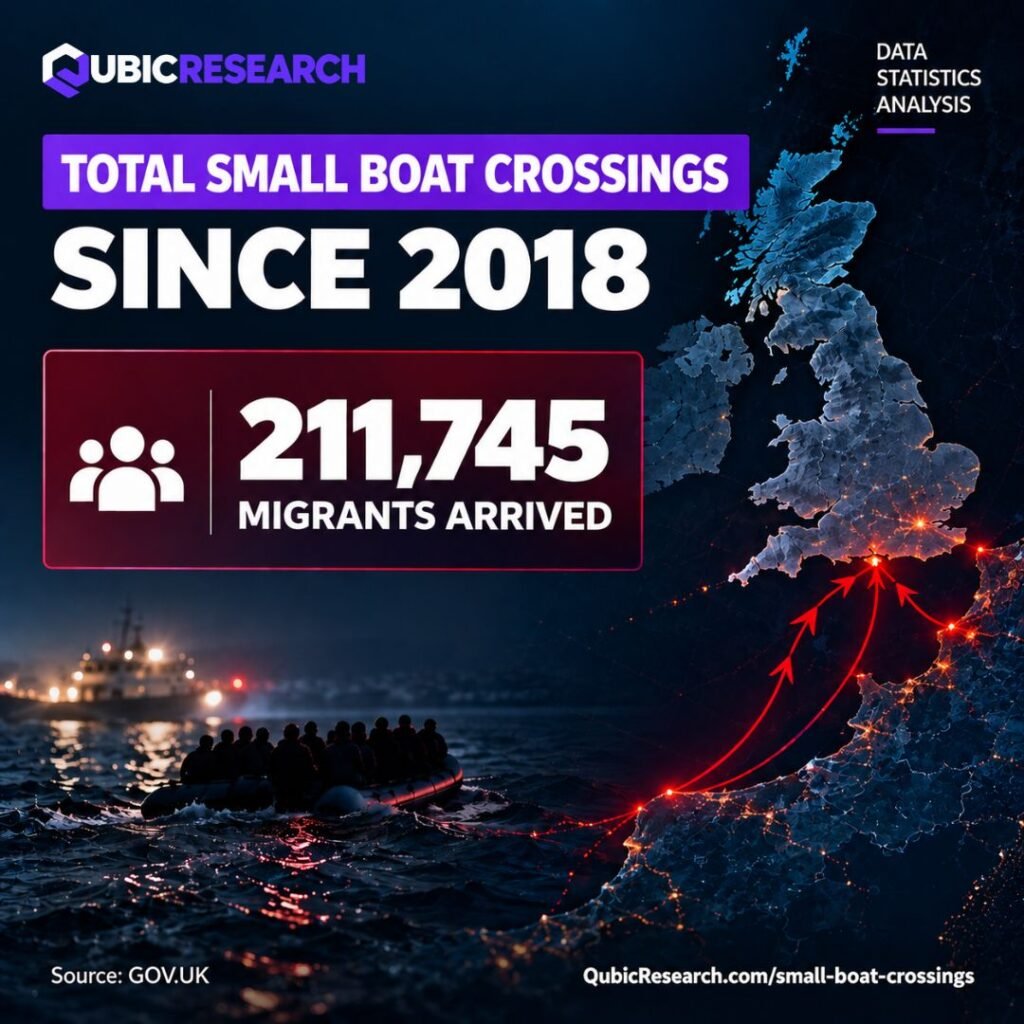
Cumulative immigration data published by the Home Office marks a historic benchmark as total English Channel small boat arrivals cross the 210,000 milestone. Official GOV.UK tracking logs confirm that 211,745 migrants have arrived in the United Kingdom via small boats since comprehensive record-keeping began in 2018. This staggering figure underscores the massive, long-term scale of irregular maritime transit across the Dover Strait over the past eight years.
The cumulative total of 211,745 arrivals reflects a profound evolution in Channel migration tactics, shifting from isolated seasonal occurrences in 2018 to large-scale, organized human trafficking operations. As political debate intensifies over border security, asylum processing backlogs, and coastal enforcement strategies, transparent long-term data provides an essential foundation for policy analysis. Accessing verified historical metrics helps track how maritime border management has adapted to evolving migratory pressures.
Total Small Boat Crossings Surge Past 211,000 Since 2018
Official government archives reveal the immense scale of maritime border activity across the Dover Strait over the past eight years. Statistical data published on the official GOV.UK portal confirms that total small boat arrivals have reached 211,745 migrants since 2018. This milestone highlights how small boat transits have grown into the primary method of unauthorized entry into the United Kingdom, reshaping border control policies and onshore reception infrastructure.
1. Historical Growth and Multi-Year Arrival Trends
Tracing the cumulative rise to 211,745 arrivals demonstrates how smuggler tactics and vessel capacities have expanded significantly since 2018.
- Initial baseline in 2018: Small boat crossings were relatively rare in 2018, with under 300 total arrivals recorded across small rigid-hulled inflatable boats.
- Rapid expansion phase: Between 2020 and 2022, organized trafficking networks scaled up operations, transitioning to industrial-grade inflatables capable of carrying dozens of passengers.
- Reaching the 211,745 milestone: Steady annual intakes through peak summer seasons have pushed the overall cumulative figure past 211,000 individuals.
Key statistical takeaways from the multi-year data
- Cumulative small boat arrivals stand at 211,745 individuals across official government logs.
- The data spans an eight-year observation period from initial tracking in 2018 through late 2026.
- Average passenger loading per boat increased from under 10 in 2018 to over 70 in recent operational years.
- Official GOV.UK dashboards maintain permanent public records of the multi-year trajectory.
2. Structural Impact on Onshore Infrastructure and Policy
Managing over 211,000 arrivals since 2018 has required significant restructuring of UK border logistics, emergency response networks, and asylum processing systems.
- Reception facility expansion: Border Force created dedicated intake hubs at Dover and Manston to handle high-density arrivals safely and efficiently.
- Bilateral security investments: The UK government has committed hundreds of millions of pounds to fund French beach patrols, drone surveillance, and joint intelligence units.
- Legislative reform drivers: Rising cumulative totals have directly prompted multiple parliamentary immigration bills aimed at streamlining processing and deterrence.
Operational highlights across the eight-year period
- Onshore screening facilities were permanently upgraded to manage rapid biometric intake for arriving groups.
- RNLI lifeboats and Border Force cutters established continuous maritime escort procedures across shipping lanes.
- International law enforcement coalitions expanded operations to intercept smuggling gear across continental Europe.
- Government tracking repositories cataloged every verified arrival to build a comprehensive historical record.
3. Escalation of Smuggler Tactics and Vessel Scaling
Evaluating the journey to 211,745 cumulative arrivals shows a significant evolution in human trafficking logistics and boat capacities since 2018.
- Industrialization of dinghy manufacturing: Organised crime groups shifted from acquiring second-hand commercial boats to sourcing purpose-built, large inflatable dinghies designed specifically for mass transits.
- Surging passenger loading density: Average loading densities increased dramatically over the eight-year period, rising from roughly 7 passengers per boat in 2018 to over 65 per craft in recent operational cycles.
- Geographic expansion of launch sites: Smuggling networks expanded departure zones beyond the immediate Calais coastline to Normandy and coastal areas near Boulogne-sur-Mer to evade beach patrols.
Key structural milestones from 2018 to present
- In 2018, Home Office tracking registered just 299 total small boat arrivals across the entire calendar year.
- Annual totals escalated rapidly to exceed 28,000 in 2021 and reached an all-time calendar peak of 45,774 in 2022.
- High-volume crossing years in 2024 and 2025 pushed cumulative figures toward the 200,000 threshold.
- Ongoing 2026 arrivals officially drove the multi-year aggregate count past 211,745 total individuals.
4. Long-Term Policy Challenges and Financial Expenditures
Reaching 211,745 cumulative small boat arrivals has reshaped the national political discourse regarding immigration controls and public spending priorities.
- Escalating accommodation costs: Managing long-term asylum claims for hundreds of thousands of arrivals drove annual accommodation and support expenditures above £3 billion at peak points.
- Legislative and enforcement overhauls: Consecutive governments introduced sweeping legislation, establishing new Border Security commands and criminalizing the endangerment of life at sea.
- Interdictions and return agreements: UK and European law enforcement agencies intensified joint intelligence efforts, seizing over 1,100 boats and engines while increasing forced and voluntary removals.
Summary of multi-year operational measures
- Border Force deployed advanced radar, aerial drones, and coastal surveillance craft to track incoming vessels across shipping lanes.
- Joint UK-France beach security agreements stopped tens of thousands of individual crossing attempts prior to departure.
- Onshore processing hubs permanently expanded digital biometric screening and health triage operations.
- Government tracking databases continue cataloguing all verified arrivals to maintain transparent historical records.
Final Thoughts on Historic Small Boat Crossing Metrics
Crossing the 211,745 total arrival milestone since 2018 illustrates the immense, multi-year scale of English Channel small boat migration. As organized human trafficking networks adapted their tactics to deploy larger inflatables, UK and European border security operations were forced to execute massive infrastructure and policy overhauls. Accessing verified, real-time statistical data remains crucial for understanding long-term migration trajectories, evaluating enforcement outcomes, and monitoring operational developments along the southern coast.
Want to see live channel migration data?
Explore more data, statistics, and analysis on our Small Boat Crossings Dashboard to track daily arrival trends, vessel counts, and historical figures.
Frequently Asked Questions
How many small boat migrants have arrived in the UK since 2018?
According to official Home Office figures, a total of 211,745 migrants have arrived in the UK after crossing the English Channel in small boats between 2018 and September 2026.
When did small boat Channel crossings begin increasing rapidly?
Small boat crossings began escalating dramatically between 2019 and 2021, rising from 1,843 arrivals in 2019 to over 28,000 in 2021 as smuggling networks shifted away from lorry transit routes.
What was the highest single year for small boat crossings?
The highest annual total on record occurred in 2022, when 45,774 migrants arrived in the UK via small boats.
How has the size of small boats changed since 2018?
In 2018, small boats carried an average of 7 people per craft. In recent years, smuggling networks shifted to larger, commercial-grade inflatables carrying an average of over 60 to 70 passengers per boat.
Where can I view long-term historical small boat migration data?
Official government data archives are published on GOV.UK, and comprehensive multi-year historical trends and daily updates can be tracked directly on our live data dashboard.