
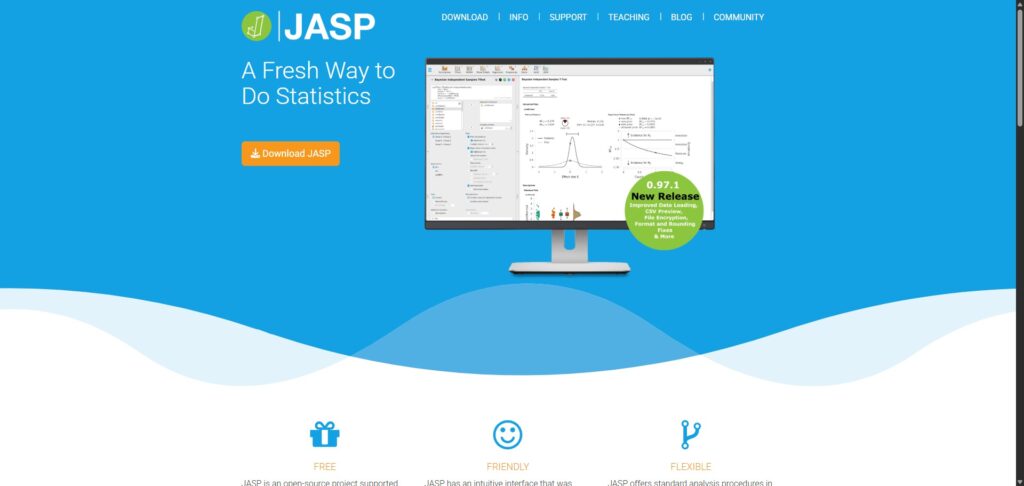
JASP is a completely free, open-source data evaluation platform and statistical analysis framework engineered to help university students, academic psychologists, and clinical researchers execute quantitative tests, analyze variables, and publish reproducible scientific results.
Operating under an acronym for Jeffreys’ Amazing Statistics Program, JASP functions as a modern, user-friendly alternative to expensive proprietary software like IBM SPSS Statistics. The platform stands out by providing an intuitive point-and-click graphical layout that houses both traditional frequentist and cutting-edge Bayesian statistical options, allowing you to run comprehensive analyses without learning complex programming code or script logic.
Highly Recommended
What can you use JASP for?
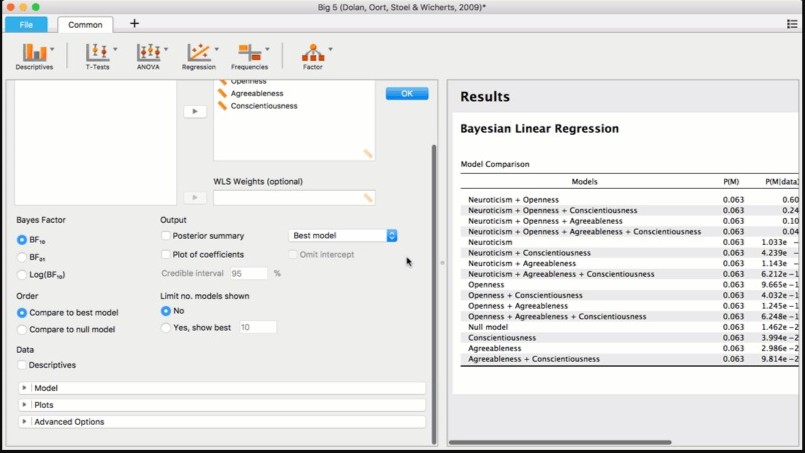
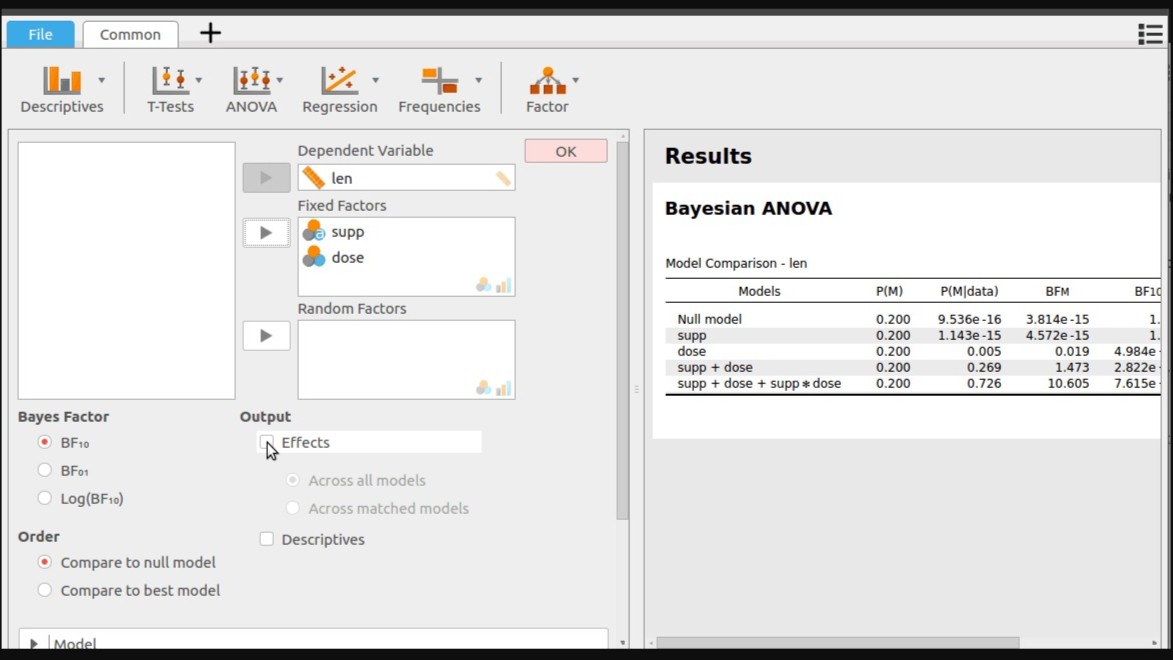
You can use it to perform standard descriptive calculations, evaluate multi-variable datasets, and cross-examine hypotheses using frequentist or Bayesian paradigms side-by-side. By selecting items from the point-and-click menu ribbons, users can execute independent sample t-tests, configure complex analysis of variance (ANOVA) matrices, and run multi-factor linear regressions easily.
It also functions as an interactive structural visualizer. The platform incorporates automated reporting engines that update your output charts, raincloud plots, and APA-formatted summary tables instantly in a right-hand preview panel the moment you toggle an evaluation checkbox or alter a variable parameter.
Who is JASP best for?
It is ideal for psychology postgraduates, social science authors, and medical trial coordinators who require a rigorous data analytics setup to check study significance without writing manual scripts.
It serves as a fantastic teaching environment for university statistics professors and research methods tutors who want an accessible, zero-cost workspace to guide students through real-world empirical experimentation.
Is JASP genuinely free?
Yes. JASP is entirely free to download, install, and run globally across any personal, academic, or corporate network under the open-source GNU Affero GPL v3 license. There are no premium registration profiles, hidden feature paywalls, or expiring student trial keys active anywhere on the application.
Because the foundational code is maintained by a public university department and supported by open-science grants, you can process unlimited variables, manage thousands of dataset rows, and install modular library expansions without incurring subscription charges.
Should I use JASP as a statistical analysis tool?
Yes. It is an excellent, comprehensive tool for discovering scholarly literature, tracing citation networks, and finding accessible versions of research documents across almost every academic discipline.
Because it covers multiple areas of study in one central place, it makes the initial discovery process fast and straightforward. It serves as an essential starting point for any literary search before diving into niche database systems.
Key Features
- Dual frequentist and Bayesian analytical modules
Allows you to run classic p-value calculations alongside progressive Bayesian probability factors inside the same interface windows. - Dynamic real-time calculation output panels
Updates all summary text tables, mathematical parameters, and data graphics instantly whenever you alter an option checkmark. - Automated APA-formatted text table formatting
Generates calculation report grids that align with American Psychological Association style rules, allowing direct pasting into manuscripts. - Modular OSF and library sharing integrations
Connects cleanly with the Open Science Framework (OSF) to publish your dataset adjustments, parameters, and analysis files for public replication. - Extensive progressive machine learning tools
Includes dedicated ribbon menus for advanced clustering models, structural equation modeling (SEM), and automated network text analyses.
Best for
- Running Bayesian hypothesis evaluations without coding background
- Generating APA-formatted data tables for journal publications
- Teaching university level psychological research and methodology sets
- Creating interactive raincloud plots and visual correlation matrix graphs
- Executing open-science replication projects using OSF framework tracks
Pros and Cons
Here are the main advantages and limitations of utilizing JASP for quantitative data analysis.
Pros
- ✓Completely open source and free with zero features locked behind commercial paywalls.
- ✓The instant side-by-side updating of calculation panels makes exploratory data analysis incredibly smooth.
- ✓Outputs tables that follow strict APA formatting guidelines, saving massive layout alteration time.
Cons
- ✗Lacks an embedded cell spreadsheet editor, meaning you cannot easily type or manually alter individual data points within the tool.
- ✗Does not integrate comprehensive automated text or macro syntax script recorders for full programming customisation.
- ✗Requires data formatting preparations in external systems prior to importing into the workspace.
How to Use JASP
Follow this quick guide to run your quantitative computations, compare statistical frameworks, and export publication-ready tables.
- Visit the Website and Download the Application
Go to the official JASP website. Access the download center to select the stable installation package matched to your desktop hardware setup, running the setup script to establish your local analytic workbench. - Import Your Prepared Data Files
Launch the program and open the main file menu tracker. Because the tool avoids internal data input boxes, load a pre-saved comma-separated value matrix (.csv), an OpenDocument sheet (.ods), or a native SPSS sheet (.sav). - Verify Variable Scale and Measure Metrics
Review your data spreadsheet columns in the workspace window. Click on the small measurement icons at the top of each variable title row to alter and check that columns match nominal, ordinal, or continuous scale rules perfectly. - Select an Analytical Menu Ribbon and Test
Click on your target method from the top panel header tab, such as selecting “T-Tests” followed by “Independent Samples T-Test”. Drag your continuous tracking measurements into the Dependent Variables field and your grouping parameters into the Grouping Variable field. - Configure Bayesian and Frequentist Parameter Settings
Check the parameter options inside the active test options layout drawer. Check the alternative hypothesis rules, activate the descriptive statistics toggles, and select the Bayesian alternative boxes to populate the calculation preview panel. - Export Your Formatted Research Outputs
Inspect the instant calculation outputs displayed inside the right-hand panel view. Click the contextual arrow icon beside any APA-style grid layout or raincloud plot to copy it directly or save the entire output log as an HTML document.
Frequently Asked Questions
Can I manually edit cell records or enter data rows directly into JASP?
No. JASP intentionally leaves out an internal grid data editor to encourage clean, reproducible workflows. Double-clicking any cell inside the viewing window opens your data sheet automatically in your local spreadsheet processor, syncing any edits back to JASP immediately.
Does JASP support advanced machine learning models and text analytics?
Yes. Recent software versions feature specialized top-ribbon extensions for complex operations. Users can open dedicated tabs for running unsupervised clustering routines, predictive classification systems, structural equation modeling, and high-speed visual network graphs.
Are my loaded research data logs uploaded to public servers when I run analysis checks?
No. JASP is a fully localized desktop utility that runs all numerical processing steps on your computer’s internal hardware components. Your dataset records, tracking metrics, and output variables remain isolated and secure on your machine.
What is the purpose of the built-in Open Science Framework integration?
The integrated OSF logging portal allows you to bind your complete JASP workspace analysis file directly to open-access registry directories. This functionality ensures that outside researchers can download your files to reproduce your entire analysis with one action.
How can I generate a specific chart layout that is missing from the core JASP options?
While the automated chart engine creates beautiful raincloud plots and descriptive figures, deep structural design changes are handled externally. You can click on any chart image element to save it as an editable SVG graphic vector file to finish adjustments in design tools.


