
Transforming raw bibliographic data into an interactive visual roadmap is essential for managing the expansive volume of modern scientific literature. When evaluating a ResearchRabbit vs Connected Papers comparison, looking past basic network charts to analyze how each engine structures its underlying discovery parameters is vital. Relying on standard manual keyword queries often causes you to overlook foundational historical studies, whereas utilizing specialized citation graph visualizers ensures that your background literature review remains entirely comprehensive.
This guide provides an objective, side-by-side analysis to help you integrate the ultimate mapping assistant into your scholarly workflow. Mastering the contrasting exploration styles and citation compilation pipelines of these dominant platforms allows you to quickly streamline real-time academic sourcing and eliminate structural blind spots from your draft. By understanding the core retrieval logic of each mapping application, you can confidently leverage live citation mapping to construct a robust scholarly foundation for your next project.
ResearchRabbit vs Connected Papers
Transitioning from passive list-based browsing to graphic literature discovery can radically accelerate your early scoping phases. When conducting a Connected Papers vs ResearchRabbit comparison, you must realize that both systems leverage different database configurations to visualize academic connections. Rather than evaluating these tools based solely on visual layout preferences, you must dissect their citation density metrics, graph regeneration limits, and library synchronization modules. This structural review ensures that your systematic discovery path remains completely reliable, protecting your background framework from analytical gaps.
1. Dissecting the Architecture of Literature Discovery Models
The primary structural divergence between the two visualizers is the mechanism utilized to initiate your literature search. Comparing these retrieval engines reveals distinct workflows for exploring broad subject fields versus narrow experimental domains.
- Iterative seed collection frameworks: The dynamic collection framework allows you to supply a growing bundle of relevant publications, which the system uses as a contextual baseline to automatically suggest forward and backward citations.
- My Experience: I regularly review tracking logs where a student began with a single document, but by systematically expanding their digital collection folder, the discovery engine revealed hidden cross-disciplinary studies that keyword lookups missed entirely.
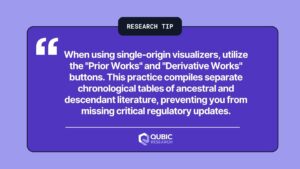
- Single-origin localized charting: The localized node network forces the system to build its visual cluster around a single unique identifier, displaying an instantaneous cross-section of closely related papers based on shared bibliographical references.
How to benchmark discovery depth across both networks
- Isolate a foundational journal article that serves as the primary methodological anchor for your active manuscript.
- Insert that single unique digital object footprint into the localized charting terminal to analyze its direct academic neighborhood.
- Take that same document and save it as an initial seed inside the competing multi-paper collection workspace.
- Add three complementary studies to the collection to test how effectively the iterative algorithm refines its subsequent recommendations.
2. Comparing Graph Visualization and Node Metric Parameters
While both applications use force-directed graphs to map academic data, they assign different meanings to their visual elements. Dissecting these visual indicators helps you identify seminal papers within a visual cluster instantly.
- Proximity and connection density: Advanced proximity layouts place nodes closer together based on co-citation strength and shared bibliographical coupling, providing an immediate overview of dominant research camps.
- My Experience: Evaluating complex visual networks used to be confusing, but tracking node sizes and shade depths allows you to identify highly cited papers and publication timelines simultaneously.
- Citation count transformations: Graphic rendering setups transform circle sizes to reflect total citation volumes, making influential papers stand out from minor pilot studies.
- Generate a visual network map utilizing your primary research query string or target digital object identifier.
- Analyze the largest circles inside the cluster to identify the foundational literature holding the highest citation metrics.
- Examine the color spectrum of the nodes to separate historical baseline studies from newly released contemporary trials.
- Click on the peripheral nodes to explore niche methodologies that branch away from the mainstream consensus.
3. Analyzing Reference Manager Integrations and Sync Protocols
The practical utility of a visual discovery tool relies heavily on how seamlessly it exchanges source metadata with your primary reference workspace. Reviewing the synchronization methods helps you maintain a unified document pipeline without experiencing manual data loss.
- Two-way automated folder syncing: The iterative collection platform features a direct, two-way integration with external spaces like Zotero, meaning that any source you save inside your visual network automatically syncs to your desktop library.
- My Experience: I have repaired numerous reference libraries where an investigator tried to download individual files from a graph system manually, introducing corrupt file strings and missing abstracts across their chapters.
- Manual export formatting chains: The single-origin system utilizes a traditional manual export pipeline, requiring you to download a standardized citation file string whenever you want to transfer a newly discovered cluster into your reference manager.
How to establish an automated synchronization pipeline
- Access the main account profile panel inside your chosen multi-paper discovery interface.
- Locate the reference manager authorization module and connect your active cloud library parameters securely.
- Select a specific collection folder within your reference manager to serve as the live destination for your visual search.
- Run a test import sequence to confirm that data points and abstract metrics transfer across your systems without manual adjustments.
4. Evaluating Search Credit Limits and Subscription Barriers
Understanding the operational access controls of each system prevents unexpected service interruptions during critical literature searches. Comparing these systemic restrictions helps you determine which tool matches your project volume requirements.
- Unrestricted community discovery models: The iterative collection network operates on an open-access system for academic researchers, allowing you to build large reference structures without hitting mandatory payment walls.
- My Experience: Working on complex meta-analyses can exhaust restrictive search allowances very quickly, making open-access models highly valuable for extensive research projects.
- Tiered processing credits: The single-origin charting system deploys a tiered access model, providing a limited number of free graph generation credits per month before requiring a premium upgrade for high-volume mapping.
How to budget your search credit usage efficiently
- Review the primary account metric summary inside your single-origin search profile to track your monthly credit balance.
- Consolidate your preliminary keyword selection so you only generate visual graphs for highly refined seed publications.
- Utilize open, multi-paper systems for your broad topic exploration and exploratory skimming sequences.
- Deploy your premium single-origin tokens specifically for high-impact papers where a rigorous cross-sectional similarity check is essential.
Final Thoughts on the ResearchRabbit vs Connected Papers Comparison
I believe that incorporating interactive network visualizers into your preliminary sourcing phase is an exceptional strategy for modern scholars, but you must select a tool architecture that matches your specific research goals. When evaluating a ResearchRabbit vs Connected Papers comparison, the structural evidence demonstrates that both systems serve distinct exploratory functions. By focusing on database depth variations, analyzing node connection layouts, and configuring automated reference manager connections, you can keep your background literature review completely robust. Ultimately, your choice of workspace controls how effectively you trace scientific knowledge—do not let credit restrictions or static interfaces limit your analytical reach.
Is ResearchRabbit a reliable research tool?
If you want to understand how dynamic, multi-paper collection models can automate your literature tracking, read our comprehensive review on ResearchRabbit as a research tool to discover how to leverage two-way synchronization to keep your source networks immaculate.
Frequently Asked Questions
Which tool is better for a comprehensive literature review project?
For an extensive, long-term project, ResearchRabbit is generally more effective because its iterative, multi-paper collection architecture evolves alongside your research paper. Connected Papers is highly optimized for short-term, targeted exploration, providing an instantaneous cross-sectional overview of a specific topic based on a single origin paper.
Do these visual mapping applications work with all academic disciplines?
Yes, both tools access extensive global data indexes that cover millions of publications across diverse disciplines, including science, medicine, engineering, and humanities. However, visual network resolution is typically strongest in fields with rigorous, well-documented cross-citation histories.
How do co-citation metrics differ from bibliographic coupling in graph construction?
Co-citation metrics analyze how frequently two separate papers are cited together by subsequent studies, which helps identify established schools of thought. Bibliographic coupling evaluates how many shared references exist between two manuscripts, helping the system connect articles that share historical roots.
Can I use ResearchRabbit and Connected Papers together in the same workflow?
Yes, combining both tools provides an exceptional discovery setup. You can deploy Connected Papers to generate a highly focused visual cluster around an obscure methodology document, and then export that data directly into a dynamic ResearchRabbit folder to track its broader historical evolution over time.
Will using visual search networks protect my bibliography from predatory journals?
While the visual charts help you identify high-impact document clusters by their connection density, you must still audit each source manually. Occasionally, low-quality journals try to manipulate metrics by cross-citing related materials, making it necessary to cross-verify questionable publications against official indexes.


