
Connected Papers is a freemium, web-based visual exploration architecture built to help students, doctoral candidates, and research scientists map out academic literature networks seamlessly.
Operating completely outside the parameters of traditional search engine listings, Connected Papers utilizes co-citation and bibliographic coupling metrics to build interactive knowledge graphs. By analyzing open metadata layers, the system arranges related publications into visual clusters, showcasing the exact lineage, connection strength, and historical context of any complex academic topic.
Recommended
What can you use Connected Papers for?
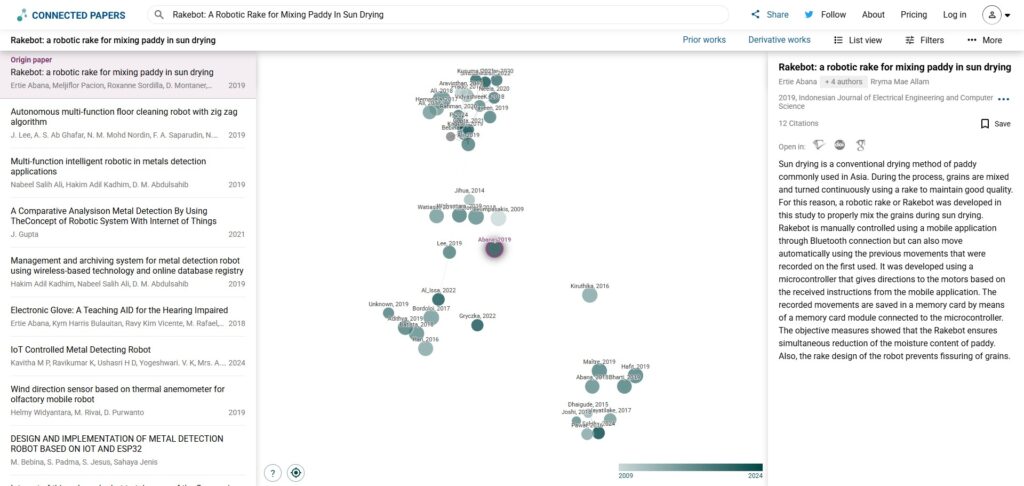
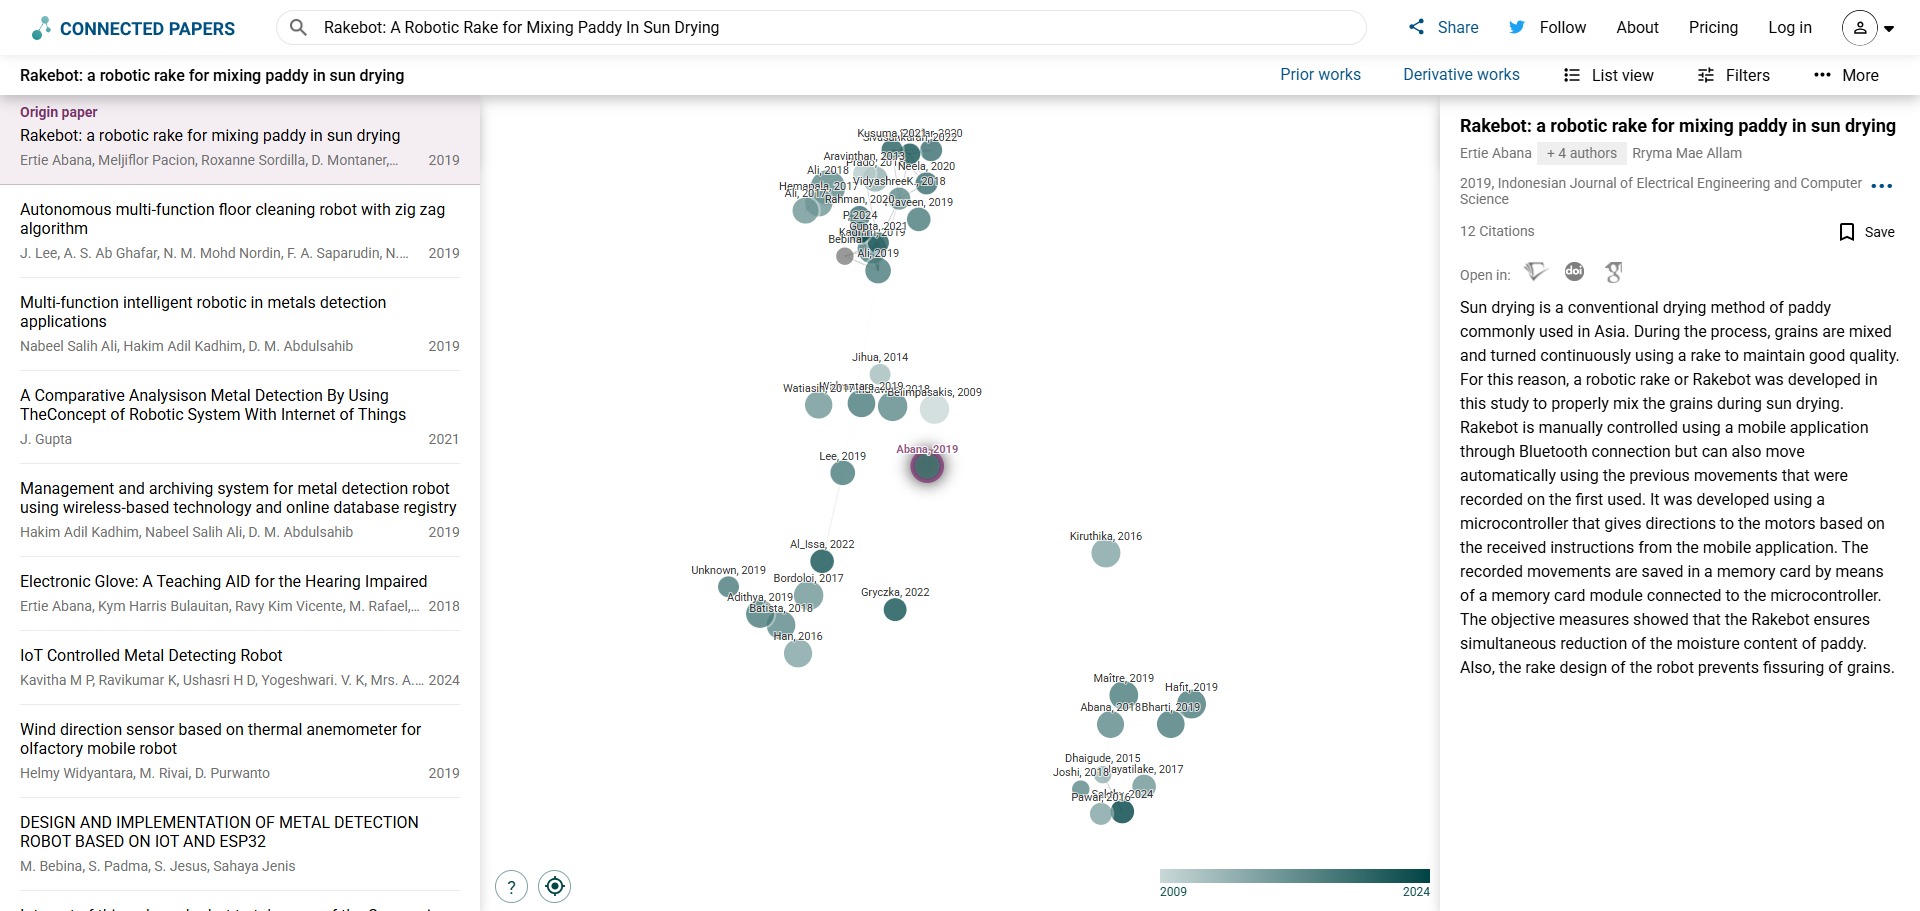
You can use it to uncover hidden study connections, locate highly cited anchor papers, and discover recent follow-up research in your domain. By entering a single seed identifier, the graph generator displays a web of roughly fifty related documents, using circle size to highlight overall citation counts and proximity to signal topic alignment.
It also functions as an automated research history tracker. Through dedicated structural filter tools, the workspace isolates prior landmark works that laid the baseline foundation for a field alongside subsequent derivative works that extended the initial findings over subsequent years.
Who is Connected Papers best for?
It is ideal for university postgraduates, PhD researchers, and multi-disciplinary scientists who are beginning comprehensive literature reviews and need to rapidly map an unfamiliar research field.
It is also a vital utility for academic authors who want to double-check their manuscript reference directories to ensure they have not overlooked critical historical data or newly published matching studies.
Is Connected Papers genuinely free?
Yes, Connected Papers offers a highly capable free entry tier that gives you access to their full visualization toolkit without upfront payment forms. This unpaid framework lets you build and fully explore up to five interactive citation graphs every calendar month, which is more than enough for casual research queries.
To eliminate these monthly creation limits, researchers can purchase an upgrade to their Academic or Business subscription plans. Transitioning your workspace profile removes all graph caps, unlocks multi-origin plotting tools, and helps support the ongoing infrastructure maintenance of the platform.
Is Connected Papers Premium Worth It?
Yes, but only if you are conducting an extensive or multi-year literature review. The free tier limits you to creating just five visual graphs per month, which can easily be used up during a single afternoon of research. Upgrading is highly valuable for PhD candidates, academic authors, and active scientists, while casual users can comfortably stick to the free plan.
When you should upgrade:
- You need unlimited graph building: The free tier stops you after five map generations. Premium plans completely remove this cap, allowing you to build and explore as many literature networks as your project requires.
- You manage multiple research topics: Upgrading lets you run continuous searches across separate chapters or subject areas without having to ration your monthly query credits.
- You want to combine multiple sources: Paid versions give you full access to advanced multi-origin plotting tools, allowing you to bridge connections between several seed papers at the same time.
If you only need to explore the academic background of a few foundational papers or check an occasional citation network, the free tool is perfectly sufficient. However, if you are actively mapping out an entire thesis or double-checking an extensive manuscript bibliography, the premium upgrade is well worth the investment.
Should I use Connected Papers as a literature mapping tool?
Yes. It is an excellent, comprehensive tool for discovering scholarly literature, tracing citation networks, and finding accessible versions of research documents across almost every academic discipline.
Because it covers multiple areas of study in one central place, it makes the initial discovery process fast and straightforward. It serves as an essential starting point for any literary search before diving into niche database systems.
Key Features
- Interactive multi-attribute citation graphs
Arranges matching publications into visual clusters where circle diameters display citation volume and shade depth reflects the year of release. - Automated Prior Works discovery panel
Isolates and highlights the primary foundational studies and common ancestor papers that were most frequently cited by the active group. - Dynamic Derivative Works analysis screen
Surfaces secondary meta-analyses, recent clinical trials, and follow-up reviews that utilized the papers in your chart as background data. - Expansive open database index syncing
Draws metadata profiles dynamically from the Semantic Scholar repository, covering hundreds of millions of international academic papers. - Bi-directional split list viewing portals
Pairs the visual nodes directly with an interactive tabular matrix, allowing you to read abstracts and inspect publisher links instantly.
Best for
- Visualising citation networks and study clusters
- Uncovering forgotten foundational research papers
- Tracking down recently published derivative studies
- Accelerating early-stage literature review mapping
- Evaluating topic connectivity using open metadata fields
Pros and Cons
Here are the main advantages and limitations of using Connected Papers for literature visualization.
Pros
- ✓Visual mappings reveal critical context paths that are easily missed in standard keyword listings.
- ✓No registration or login profiles are needed to construct your initial research graphs.
- ✓Prior and Derivative views simplify tracing the timeline history of complex scientific ideas.
Cons
- ✗The free account structure enforces a rigid ceiling of five fresh graph generations per month.
- ✗The engine cannot build a single graph from multiple separate source papers simultaneously.
- ✗May fail to index extremely obscure localized journals that lack standard DOI tracking metrics.
How to Use Connected Papers
Follow this quick guide to map out your literature network and discover related research visually.
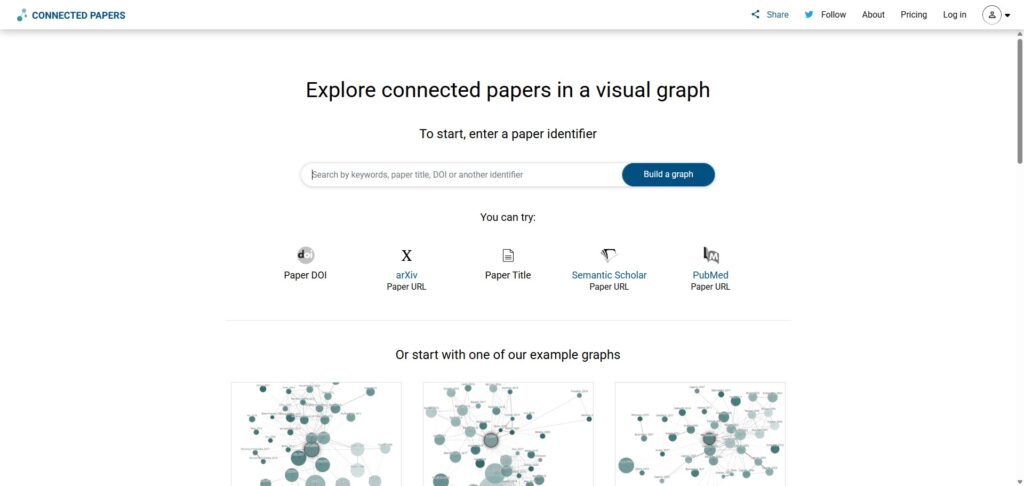
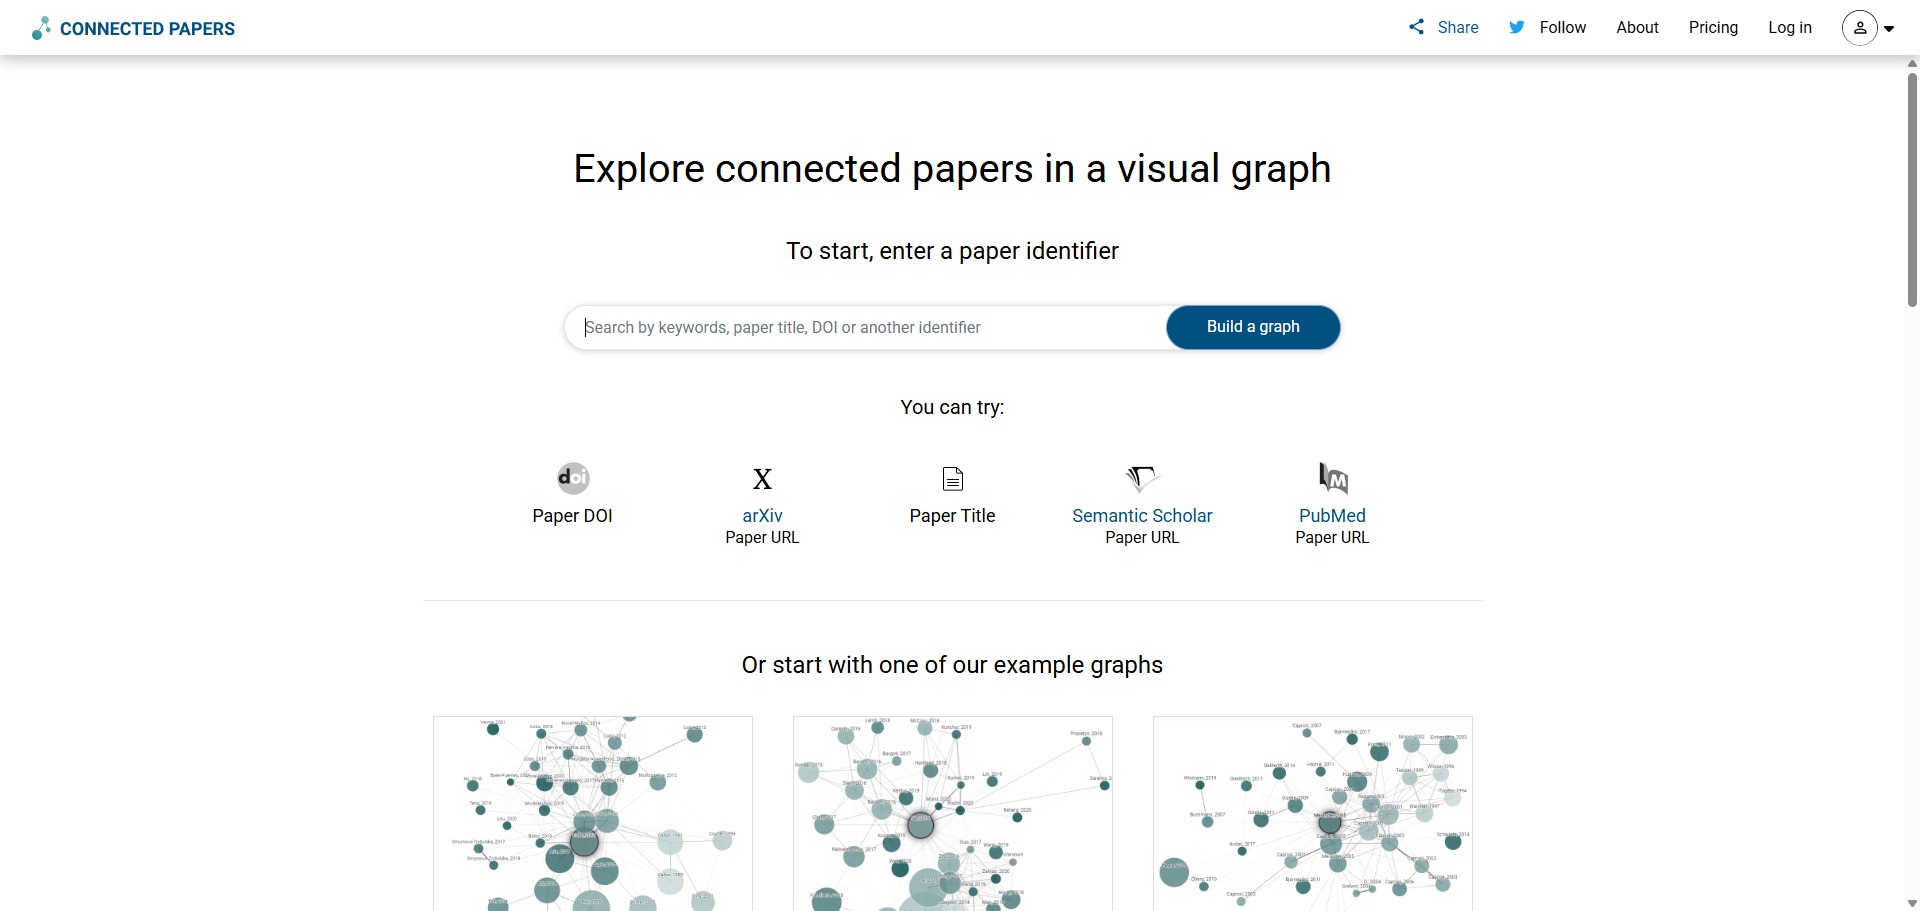
- Visit the Website
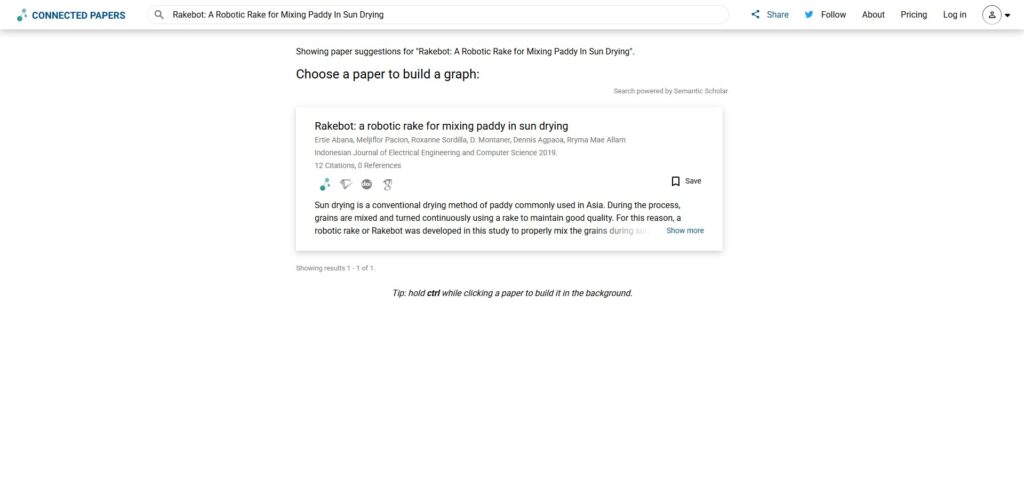
Go to the official Connected Papers website. Because the platform allows open entry, you can start building your first visual network directly from the homepage without needing to log in. - Enter a Seed Paper Identifier
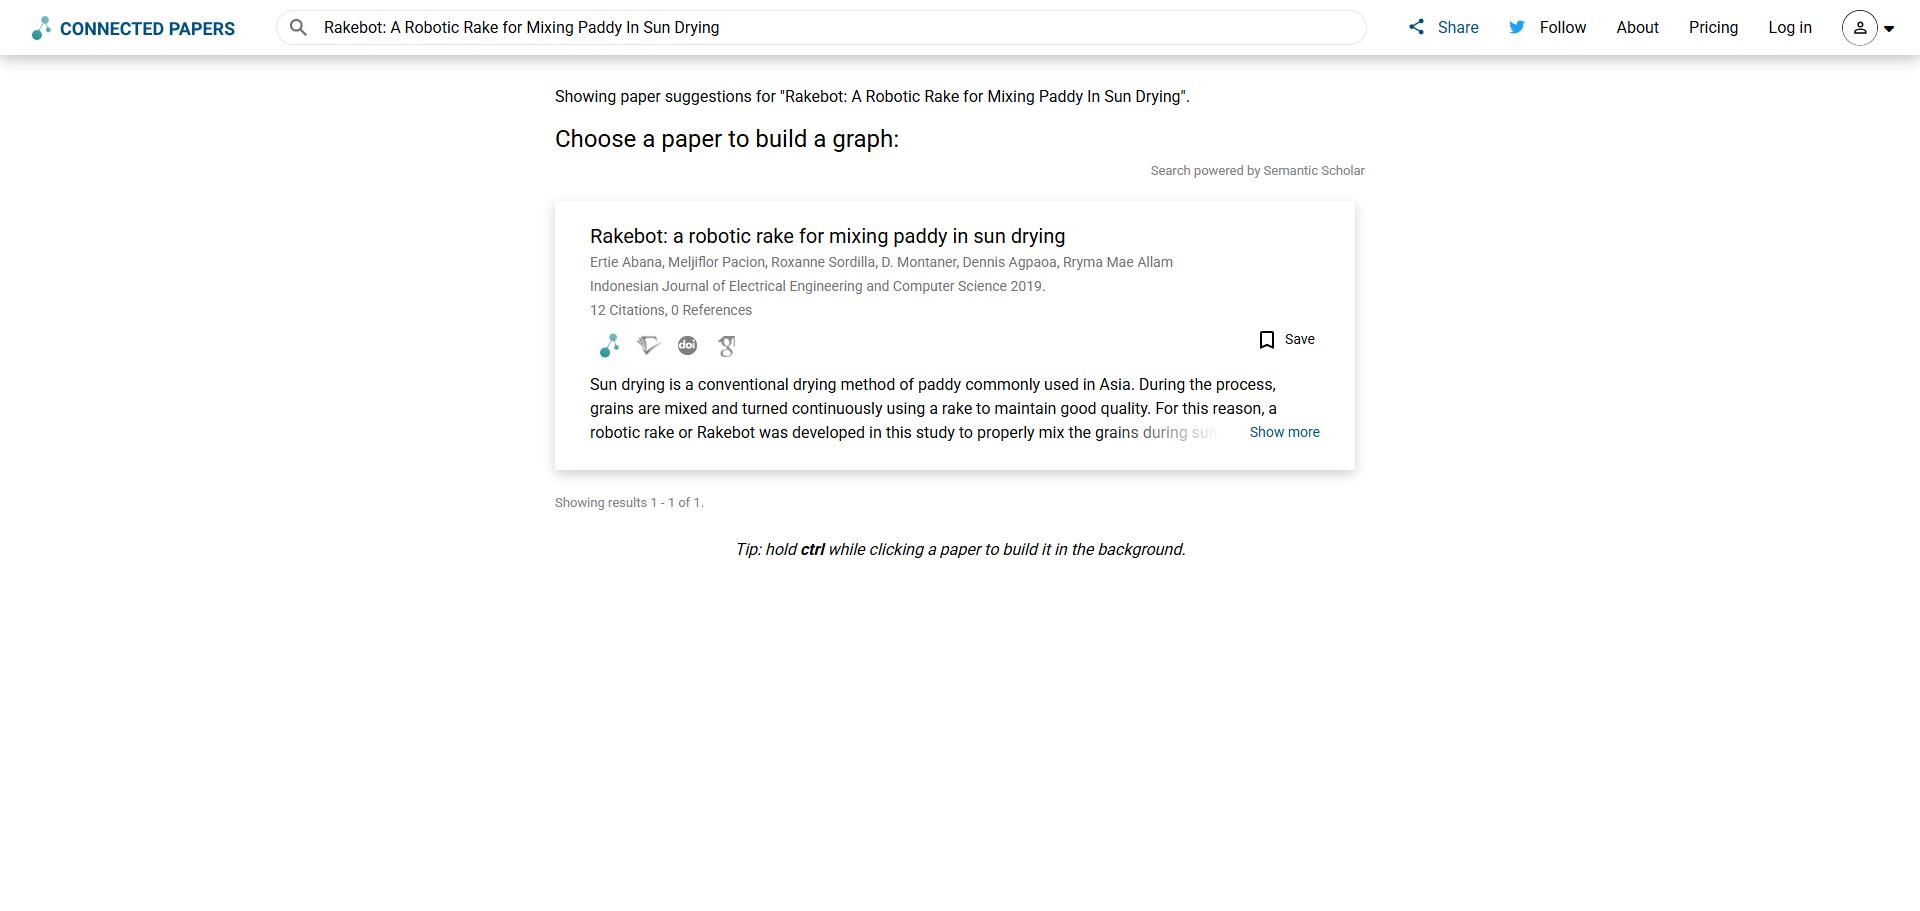
Type the title, DOI number, arXiv identifier, or Semantic Scholar URL of a strong foundational paper into the central search box. This “seed paper” will act as the anchor point for your visual map. - Generate the Interactive Graph
Click the build button to generate your visual network. The system will create an interactive cluster graph showing roughly fifty related papers, where circle sizes reflect citation volume and closeness indicates topic similarity. - Explore Foundational Prior Works
Click the “Prior Works” button in the menu layout to open a separate tracking panel. This isolates the landmark ancestor papers that were most frequently cited by the studies inside your active graph. - Track Recent Derivative Studies
Switch to the “Derivative Works” tab to view subsequent literature. This list displays recent reviews, clinical trials, and follow-up papers that utilized the items in your graph as background data. - Review Abstracts and Export Citations
Select any node circle within the graph to open its detail panel on the side. Read the paper abstract instantly, use the links to find open-access versions, or export the metadata as a BibTeX file for your citation manager.
Frequently Asked Questions
How does Connected Papers decide which articles to include in a visual network?
The algorithm does not rely on direct sequential citation lines. Instead, it measures co-citation indices and bibliographic coupling, evaluating how many shared reference marks two separate papers contain to map their thematic overlap relative to the rest of the field.
Can I export my finalized visual networks into a desktop citation manager?
While you cannot export the visual image layout directly as an interactive graph file, you can copy the text metadata rows. The system allows you to export the full collection of papers within a graph directly into standard BibTeX format paths for easy importing into Zotero.
What is a seed paper and how do I select the best one for my project?
A seed paper is the primary source article used to anchor the graph-building engine. For optimal results, you should select a highly relevant peer-reviewed article that sits directly at the center of your chosen topic and contains an extensive, healthy bibliography file.
Will the graph refresh automatically when a new paper is published online?
Graphs represent a calculated snapshot of database parameters at the specific moment of query creation. To capture recently published manuscripts or updated citation records, you must prompt the system to reconstruct a fresh iteration of the graph from your seed item.
Is there a special scholarship program for researchers who need more graphs?
Yes. Connected Papers operates a dedicated scholarship application portal for individual students or academic researchers who require premium access but truly lack the financial resources to purchase a plan. Eligible users can contact the developers to request a free premium profile.